Our Fast Staffing Calculator is a free call center staffing calculator from Portage Communications. It gives you fast, complete Erlang-C call center staffing and financial predictions. You can compare the performance and service level of your call center for varying agent levels over a given time period. After downloading it, read the example below to learn how to use. Feel free to pass on the download link or downloaded app to others. Our call center staffing calculator runs on all versions of Windows.
How to Use the Call Center Staffing Calculator
The Fast Call Center Staffing Calculator is used to closely analyze staffing levels for a specific time period within a workday, for example, the busiest hour, the least busy hour, or the typical hour. Arrival periods other than an hour can be analyzed too (15 min, 30 min., etc).
Enter the following values in the Staffing Parameters section:

These values say that 569 calls are expected in an arrival time of 1 hour, each having an average talk time (call duration) of 2 minutes and 30 seconds, and that the agents’ after call work time (often called “wrap-up” time) will be 55 seconds. They also say that staffing calculations should be done assuming a service level goal of answering 80% of these calls within 15 seconds of arriving, and that callers will wait in queue on average 3 minutes (the Avg. wait before abandon) before they hang up.
Clicking on the Calculate button brings up the Staffing Performance and Staffing Financials tables. The Staffing Performance displays predicted performance statistics for various agent levels. The Optimum number of agents for service level goal tells you the number of agents that will most closely match the service level goal of answering 80% of all calls within 15 seconds:

Use the vertical scroll bar to view all the rows in the Staffing Performance table. Note that the number of agents that most closely matches the service level goal of answering 80% of the calls in 15 seconds is 38 agents.
The numbers in this table illustrate some very important things about call center performance and queuing theory that aren’t what we might expect. Note how the addition of just a single agent to a group of 34 or 35 agents would dramatically improve the percent of calls queued (Queued), average speed to answer (AvgSpdAns), the average time in queue (Q time), and the average queue length (Avg Q).
As a result, the percentage likely to abandon (Abandon) will also show marked improvement. Conversely, taking one agent away from a group of 28 with the thought that you will then work your agents a lot harder does not make a lot of sense: you increase their average percentage of time on a call (Occupancy) by only 3% (85% to 88%) and at the same time give much worse service to callers.
All call center scenarios have a critical break-off point where the addition or subtraction of just one, or a very few agents, makes dramatic differences in performance. In this small call center example, just one agent makes a very big difference at a certain point. In order to run an efficient operation, the call center manager must know where this point is.
As you can see, fine-tuning the number of agents is extremely important in terms of meeting a desired service level. Now take a look at the Staffing Financials table:

For financial considerations, the staffing level also shows some important things. Note that the difference in profit can vary dramatically with only a slight drop in the number of agents. At a level of 38 agents, this example shows that the profit per call is at its highest level of $19.90. With only a slight drop to using 34 agents, a lot of money is lost per call due to the poor customer service level caused by higher queue times and caller abandonment.
The Staffing Performance and Staffing Financials tables in this example show that the best staffing level to meet both the desired service level and the maximum profit per call is 38 agents, but it is possible that the optimum level of agents for service and profit to be different. The Fast Staffing Calculator will show you when they are.
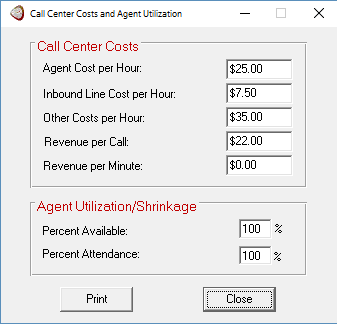
These costs are calculated with the dollar values you enter in the Costs/Utilization window:

You enter your agent, line and other costs as well as any revenue value you can give to an answered call or minute on a call. Percent Available is the percentage of time your agents are actually productive while at work, and Percent Attendance is the percentage of scheduled agents who show up for work. These are taken into account by the calculations to increase the calculated staffing levels due to staff inefficiencies.
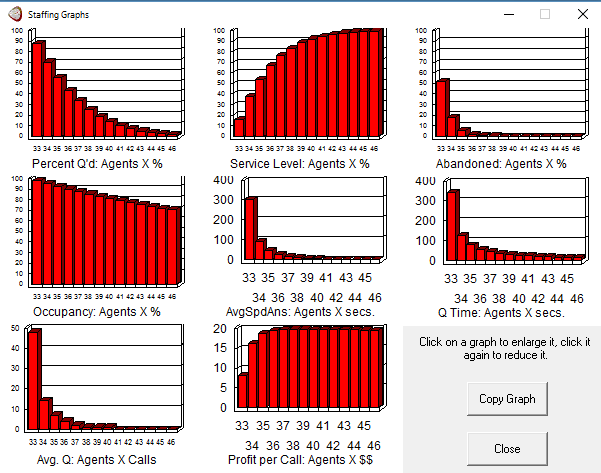
Now click on the Graphs button to bring forward the Staffing Graphs window:

The various graphs give an intuitive feel for how the call center will perform for different levels of staffing and where the performance break-off point is. The number of agents is on the horizontal, x-axis of each graph. The graphs underline the important point that slight changes in the staffing level can have a dramatic effect on the performance of the agents and the quality of service given to callers. Note how steep the graphs for Percent Queued, Avg. Speed to Answer, and Average Calls in Queue are compared to Agent Utilization.
Clicking on a graph will enlarge it for better viewing. You may also copy the graphs to the Windows clipboard.
Close the Fast Staffing Calculator by clicking the Exit button.
